Target Audience Analysis
Deeply understanding your target audience is the cornerstone of brand success. Whether you're a startup seeking market entry points or an established brand pursuing growth breakthroughs, systematic target audience analysis is an essential strategic tool. Who are your users, in what scenarios do they make decisions, why do they choose you over competitors—the answers to these questions form the starting point for brand positioning, product strategy, and marketing communications.
Target audience analysis goes far beyond piling up demographic data (age, gender, income). It's about deeply understanding user needs, scenarios, motivations, and behavioral patterns. An accurate user persona can: guide product feature prioritization, optimize marketing communication efficiency, enhance brand positioning accuracy, reduce customer acquisition costs, and increase user lifetime value. Systematic user analysis enables companies to avoid "gut-feeling" decisions and replace subjective guesses with data-driven insights.
Business Value of Audience Analysis: ROI and Conversion Rate Improvement Data
Quantified Evidence from Customer Success Cases
According to HubSpot research, companies using detailed user personas show significant marketing efficiency improvements:
- Conversion rate improvement: 73% of companies report 2-3x conversion rate increases
- Customer acquisition cost reduction: Average 40-60% reduction in CAC
- Customer retention rates: Companies using user personas have retention rates 35% above industry average
- Marketing ROI: Precisely targeted marketing campaigns see 5-8x ROI improvement
Chinese market data is even more compelling. iResearch's 2023 research report shows:
- Brands with deep audience analysis achieved 47% improvement in lower-tier market penetration
- Precise marketing to Gen Z consumers increased repurchase rates to 2.3x industry average
- Brands operating private domain traffic based on user personas increased user lifetime value (LTV) by 62%
Impact of Audience Analysis on Key Metrics
Conversion Rate Improvement Path:
- Click-through rate (CTR) improvement: Ad creatives customized based on user interests increase CTR by 2-4x
- Landing page conversion improvement: Copy that addresses user pain points increases conversion rates by 50-80%
- Sales lead quality improvement: Leads from precise personas show 40% higher closing rates
- Customer retention improvement: Deeply understood customer relationships increase retention rates by 25-35%
Cost Optimization Effects:
- Reduced ad waste: No longer advertising to "non-target users," saving 30-50% of budget
- Improved content production efficiency: Clear user needs double content iteration speed
- Lower customer service costs: Understanding user pain points improves problem resolution efficiency by 35%
- More accurate R&D direction: Avoiding false demands improves R&D resource utilization by 40%
Core Tool for Brand Growth Strategy
Audience analysis is not a one-time market research project, but a strategic engine for brand growth:
Growth Stage 1: 0-1 Stage
- Precisely target early adopters
- Quickly validate product-market fit
- Build foundation for word-of-mouth传播 (KOC cultivation)
Growth Stage 2: 1-10 Stage
- Identify high-value user segments (20% of users contribute 80% of value)
- Optimize customer acquisition channel mix (reduce CAC)
- Maximize user lifetime value (LTV maximization)
Growth Stage 3: 10-100 Stage
- New market entry strategy (geographic/demographic expansion)
- Brand positioning upgrade (from functional to emotional)
- Ecosystem user operations (cross-product cross-selling)
The following will delve into how to scientifically and executable complete target audience analysis, build truly effective user personas, and showcase successful cases and best practices from the Chinese market.
What is Target Audience Analysis: Core Concept Analysis
Target audience analysis is the process of identifying, describing, and understanding a brand's core customer groups through systematic research. It's not a one-time market research effort, but continuous insight accumulation and validation.
Three Dimensions of User Personas
Demographic Dimension: This is the foundational level of user personas, including quantifiable characteristics such as age, gender, geographic location, income level, education background, occupation type, and family status. These data help companies define "who" the target users are, but this alone is insufficient. For example, two urban female professionals aged 25-35 with similar incomes—one may be a pragmatist pursuing cost-performance ratio, while another may be an idealist focused on quality—their brand expectations and purchasing behaviors are completely different.
Behavioral Dimension: Describes how users act, including information acquisition channels (social media, search engines, friend recommendations), purchase frequency, brand loyalty, usage scenarios, decision processes, etc. Behavioral data is the most objective source of user insights, obtainable through website analytics, sales data, and user behavior tracking. For example, high-value users might visit the website 3+ times weekly, view an average of 5 pages, prefer purchasing between 2-4 PM, and primarily come from mobile devices. These behavioral patterns can guide marketing placement and product design.
Psychographic Dimension: This is the deepest and most important dimension, including values, lifestyle, personality traits, purchase motivations, pain points and fears, and aspirations. Psychographic data explains "why" users act this way. For example, for the same premium product, some purchase for identity recognition ("I deserve the best"), some for quality assurance ("don't want to spend time researching choices"), and some for social display ("hope to gain recognition"). Understanding these deep motivations is key to brand positioning and communication strategy.
Three Values of Target Audience Analysis
Precise Targeting Value: Clear target audience analysis helps brands find the most valuable demographic segments most likely to be moved by brand value. Rather than "everyone is my customer," it's better to "create unique value for specific groups." Precise targeting enables: concentrating resources on high-value customers, improving marketing ROI, establishing clear differentiation, and avoiding homogeneous competition.
Product Innovation Value: Deep user insights guide product feature prioritization and experience design. Understanding users' real scenarios and pain points enables product teams to: identify unmet core needs, avoid feature bloat (false demands users don't need), optimize user experience journeys, and design interactions matching user habits. Many product failures stem not from poor technology but from failing to solve problems users truly care about.
Communication Efficiency Value: Understanding target users' information acquisition habits and language preferences can significantly improve marketing communication efficiency. Precise user analysis enables companies to: choose the right channels (where users appear), use appropriate language (how users speak), address real pain points (what users truly worry about), and create resonant content (what users are willing to share). Communication is not about "saying more," but "saying more precisely."
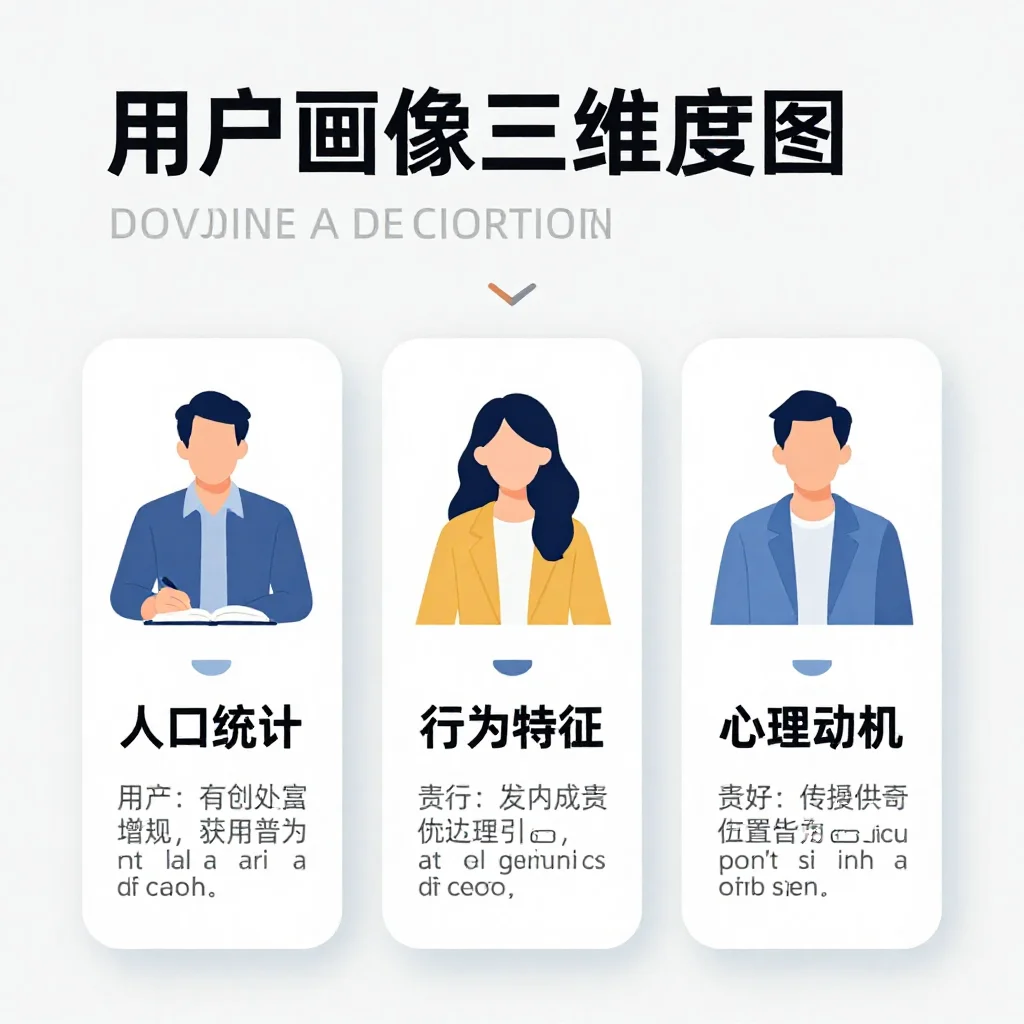 Figure 1: Three Dimensions of User Personas—Complete Insights from Surface Characteristics to Deep Motivations
Target Audience Analysis Process: Five-Step Practical Guide
Step 1: Data Collection and Information Aggregation
User analysis begins with data collection, requiring quantitative and qualitative data from multiple channels.
Quantitative Data Sources: Website and app analytics (Google Analytics, Mixpanel) provide user behavior data—traffic sources, page browsing paths, dwell time, conversion rates, device types, etc.; CRM and sales data provide customer value information—purchase frequency, average order value, repurchase rates, lifetime value; social media data provides audience preferences—platform distribution, engaged content, shared topics; third-party market reports provide industry trends and competitive landscape. These quantitative data paint the "objective facts" of user behavior.
Qualitative Data Sources: User interviews (one-on-one in-depth interviews) are the most direct method, using open-ended questions to understand user motivations, pain points, and decision processes; focus groups (6-8 person group discussions) can observe interactions and consensus/divergence among users; surveys (online or offline) can quickly collect large-scale quantitative and qualitative feedback; customer service records and sales feedback are treasure troves of real user problems and concerns; social media monitoring understands how users talk about brands and competitors in public settings.
Competitor Analysis: Studying competitors' user groups and communication strategies can quickly identify market gaps and differentiation opportunities. Analyze competitors: who follows them (fan personas, commenter characteristics), how they describe users (official website copy, ad content), how users evaluate them (positive and negative points), through what channels they reach users. Competitor analysis is not about imitation, but finding your unique positioning after understanding the market status quo.
Step 2: Segment Identification and Priority Ranking
With the data foundation, need to identify user segments and determine priorities.
Behavioral Segmentation Method: Divide groups based on user behavior patterns, not just demographics. Common segmentation dimensions include: usage frequency (heavy, medium, light users); purchase motivation (value-seekers, quality-seekers, convenience-seekers); usage scenarios (home use, office use, travel use); decision factors (price-sensitive, brand-sensitive, feature-sensitive); pain point types (efficiency issues, cost issues, experience issues). Behavioral segmentation predicts user behavior and needs better than demographics.
Value Assessment Matrix: Among all possible user segments, find the most valuable groups. Evaluation dimensions include: market size (how big is this segment), growth potential (is it growing rapidly), willingness to pay (can they accept reasonable pricing), service cost (customer acquisition and operational costs), competition intensity (blue ocean or red ocean). Score each segment on these dimensions to identify the 1-3 highest-priority segments by comprehensive value. Remember, early-stage resources are limited—must focus.
Reachability Validation: Even the most valuable segment isn't a good choice if it can't be effectively reached. Validate reachability: what channels are users concentrated in (specific social media, offline venues, professional communities), is customer acquisition cost acceptable, can sustainable reach mechanisms be established, are there trust transmission paths (opinion leaders, KOLs). If core users are too scattered or reach costs are too high, may need to adjust segment definition or find different reach strategies.
AI Tool Assistance: Modern data analytics tools (like AI brand naming tools, user persona platforms) can accelerate segment identification. Machine learning algorithms analyze massive user data to automatically identify behavioral patterns and segment groups. But tools only assist—final segment definition and priority decisions still require human judgment and business intuition.
Step 3: Creating User Personas and Scenario Mapping
After determining priority segments, need to create specific user personas and usage scenarios.
Core Elements of User Personas: Give the persona a name (like "New Professional Xiao Wang") to make it more concrete. Include key information: basic information (age, occupation, income, city); core goals (what they want to achieve); main pain points (what problems they encounter); purchase motivation (why they choose you); decision factors (what they consider when making choices); information channels (where they get information); language preferences (how they describe needs); price sensitivity; brand awareness level. Create 1-2 typical personas for each segment—usually 3-5 personas cover 80% of target users.
User Journey Mapping: Describe the complete process from user awareness of need to purchase completion (and subsequent usage). Typical journey includes: Trigger Stage—in what scenario does the need arise (e.g., "discovered low work efficiency, need collaboration tools"); Exploration Stage—how they seek solutions (search engines, friend recommendations, industry websites); Evaluation Stage—what options and criteria are compared (price, features, reviews, trials); Purchase Stage—final decision and purchase process; Usage Stage—actual experience and satisfaction; Recommendation Stage—willingness to recommend and why. Each stage's pain points, concerns, and expectations need detailed description.
Typical Scenario Description: Combine user personas and journeys to create specific "user stories." For example: "Xiao Wang is a 26-year-old product manager at a mid-sized internet company. She discovered low team communication efficiency and decided to find collaboration tools. She saw a Slack vs. DingTalk comparison article on Zhihu, downloaded 5 tools for trial, and ultimately chose DingTalk because the interface felt familiar and it supports Chinese. She cares about usability, price, and colleague acceptance." This specific scenario description helps product, marketing, and customer service teams align user understanding.
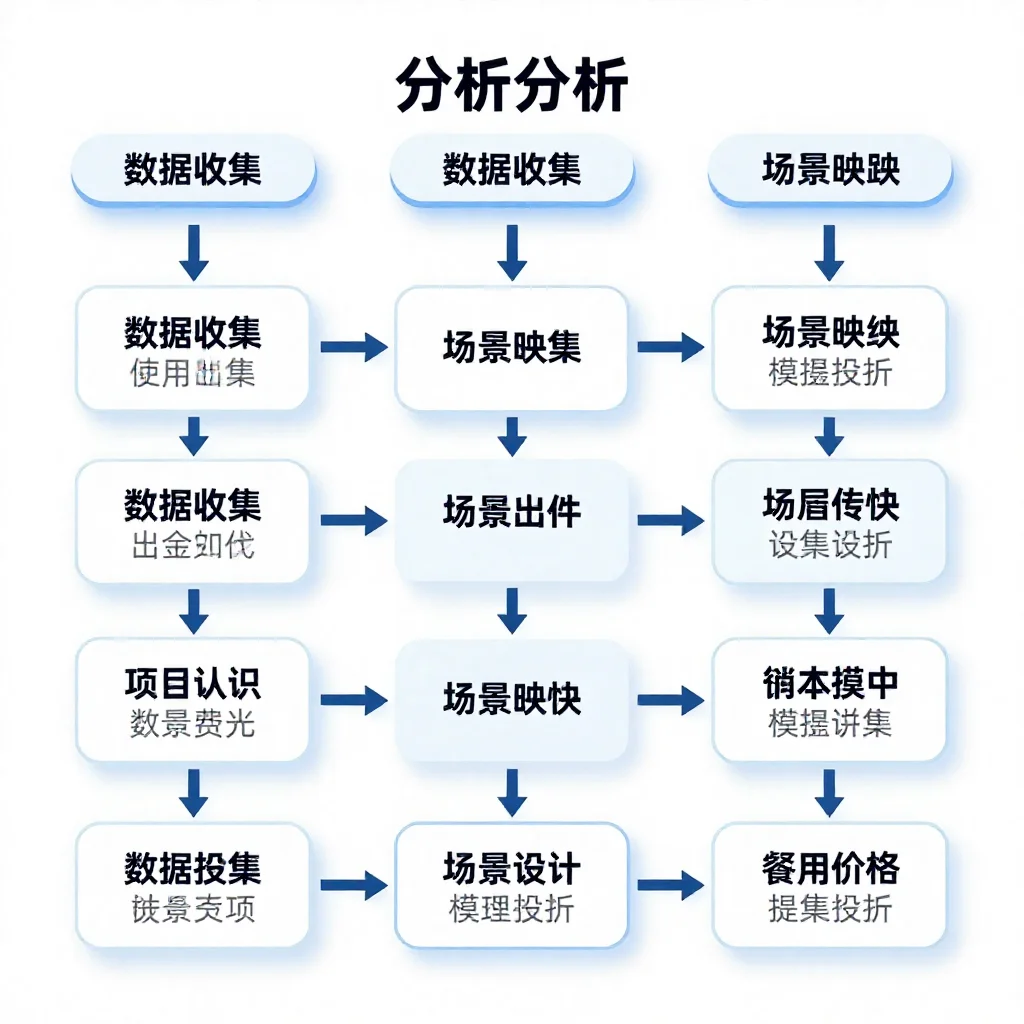 Figure 2: Five-Step Target Audience Analysis Process—Systematic Method from Data to Insights
Step 4: Validation and Iterative Optimization
Preliminary user personas need validation and iteration through actual user feedback.
User Validation Methods: Show created personas to real users (especially high-value users) for feedback. Ask "Is this like you?", "Is the description accurate?", "What's missing or wrong?" Can also conduct usability testing to observe if actual usage behavior matches persona predictions. If predicted behavior differs from actual behavior, the persona has issues and needs correction.
A/B Testing Validation: If resources allow, can validate user insights through A/B testing. For example, for the same feature or marketing content, design two versions—one based on persona A insights, one based on persona B insights, and see which performs better. Data validation is more reliable than subjective discussion.
Continuous Data Monitoring: User personas aren't set in stone. Periodically (e.g., quarterly) review key metrics: have user demographics changed, are there new trends in behavioral patterns, have pain points evolved, have competitors changed user expectations. Update personas based on data changes to ensure insights remain current.
Cross-Departmental Alignment: Ensure all teams (product, marketing, sales, customer service) have consistent understanding of user personas. Regularly hold persona sharing sessions to discuss latest insights and cases. When new employees join, persona training should be part of onboarding. Unified understanding brings consistent user experience.
Step 5: Application to Brand Decisions
The ultimate value of user analysis is to guide actual brand and business decisions.
Product Decision Applications: User insights directly guide product feature prioritization and design. Specific applications include: feature prioritization (based on user pain points and need intensity); user experience design (matching user habits and preferences); pricing strategy (based on user willingness to pay and price sensitivity); new feature validation (testing alignment with real user needs); product iteration direction (based on user feedback and behavioral data).
Marketing Communication Applications: Understanding how users acquire information and make decisions can significantly improve marketing efficiency. Specific applications include: channel selection (advertise where users appear); content strategy (use topics and language users care about); ad creative (address user pain points and motivations); SEO keywords (use users' search vocabulary); social media strategy (engage on platforms where users are active); PR and publicity (choose media and KOLs users follow). Precise user insights ensure every marketing dollar is spent where it matters most.
Brand Positioning Applications: User insights define "for whom, what problem to solve, what unique value" the brand has. Specific applications include: brand positioning statement (clarify target users and core value); brand personality building (match user psychological expectations and aesthetics); brand naming and visual identity (align with user language preferences and cultural background); brand communication messages (use expressions users understand and resonate with).
Best Practices and Techniques for Target Audience Analysis
Practice 1: Start with "People," Not "Data"
The essence of user personas is understanding "people," not piling up data points.
Avoid Over-Quantification: Don't fall into the "average trap." Knowing "average age 28" is less valuable than understanding "they just entered the workforce, eager to grow but worried about making mistakes." Knowing "60% from first-tier cities" is less valuable than understanding "they live fast-paced lives, pursue efficiency but fear loneliness." Numbers are the starting point; understanding people is the goal.
Tell User Stories: Convert data into specific user stories and scenarios. Don't say "price-sensitive users," but tell the story: "Xiao Li just graduated, earns 5000 yuan monthly, rents an apartment, can only allocate 200 yuan monthly for entertainment, compares at least 3 platforms for every purchase." Such specific stories are more easily remembered and resonate with teams, guiding actual decisions.
Maintain Empathy: When analyzing users, stay open and curious, not judgmental. Don't say "users are too stupid to use this feature," but ask "where didn't we express ourselves clearly, causing user confusion." True user insights come from respect and understanding, not superiority.
Practice 2: Balance Existing Users with Ideal Users
User analysis needs to balance "who's buying now" with "who should buy."
Existing User Analysis: Analyze current customer base to understand why they chose you. This is foundational data and must be accurate. But note that existing users may not be optimal users, especially when brand plans transformation or positioning adjustment. Over-reliance on existing user insights may prevent brand from breaking through status quo.
Ideal User Definition: Based on brand vision and strategy, define user segments "that should be served." Ideal users may: have stronger willingness to pay, lower service costs, greater growth potential, better match brand values. Ideal user definition guides brand evolution direction.
Migration Path Planning: If ideal users differ significantly from existing users, need to plan how to migrate from existing to ideal users. Migration strategies include: product feature adjustments (better match ideal user needs); marketing focus shift (more precisely reach ideal users); brand positioning optimization (more attractive to ideal users). Migration is gradual—avoid suddenly abandoning existing users causing revenue cliff.
AI Tool-Assisted Analysis: AI brand naming tools and user analysis platforms can help companies analyze differences between existing and ideal users, providing migration strategy recommendations. Data-driven approaches reduce migration risks.
Practice 3: Dynamic Updates, Not One-Time Completion
User insights are a continuous accumulation process, not a one-time project.
Regular Review Cadence: Recommend reviewing user personas and data quarterly to check for new trends or changes. User needs and behaviors change rapidly, especially in the digital age. Insights from a year ago may be outdated. Regular review ensures brand decisions always based on latest user understanding.
Capture Weak Signals: Besides mainstream trends, also pay attention to edge user feedback and anomalous data. These weak signals may be early indicators of future trends. For example, if several atypical users mention a need repeatedly, it could be the next growth point.
Diversified Data Sources: Don't over-rely on single data source (like only looking at website analytics). Combine quantitative data (analytics tools) and qualitative data (user interviews); internal data (sales, customer service) and external data (social listening, industry reports). Multiple perspectives provide more comprehensive user understanding.
Establish Feedback Mechanisms: Build systematic user feedback collection and analysis mechanisms. In-product feedback entry, regular user surveys, periodic customer service data analysis, user community monitoring. Let user insights continuously flow into the organization, not occasional "blitz research."
Practice 4: Cross-Departmental Sharing and Alignment
The value of user insights lies in consistent understanding and application across the entire organization.
User Persona Documentation: Create clear, easy-to-understand persona documents, including basic information, story descriptions, key insights, application scenarios. Use visual elements (photos, charts) to enhance memorability. Documents should be concise (recommend 1-2 pages per persona), avoid over-complexity causing no one willing to read.
Regular Sharing Mechanisms: Regularly (e.g., monthly) hold user insight sharing sessions to discuss latest cases and data. Invite different teams to participate, encourage sharing their own encountered user stories and insights. When "user story culture" is established internally, user understanding naturally integrates into daily decisions.
Reference in Decisions: In important decisions (product features, marketing campaigns, brand positioning), explicitly reference user personas. Ask yourself "Would Xiao Wang like this?", "Does this solve Xiao Li's pain point?" Visualize user personas in prominent office locations, constantly reminding the team "who we're doing this for."
New Employee Training Content: User insights should be core content in new employee onboarding. Only when new employees truly understand users can they make decisions aligned with user interests.
Deep Case Studies of Chinese Market Audience Analysis
Case 1: Xiaomi's Fan Economy—From "Tech Enthusiasts" to "Mi Fan Community"
Background and Challenge: Xiaomi entered the smartphone market in 2010, facing powerful competitors like Apple (premium positioning), Samsung (full price range coverage), and Huawei (telecommunications giant). Limited initial budget, almost impossible for traditional advertising, needed to find breakthrough point.
Audience Insight and Analysis Process:
Through deep forum analysis and user interviews, Xiaomi team identified the overlooked niche of "tech enthusiasts":
- Demographics: 20-35 year old males, first- and second-tier cities, IT-related occupations, monthly income 5000-15000 yuan
- Behaviors: Daily browse tech forums, follow spec parameters, like flashing and customizing ROMs, active on XDA and Feng forums
- Psychographics: Pursue "tech-savvy" identity, enjoy sharing and recognition, detest "being treated as fools by manufacturers"
- Core Pain Points: Premium phones too expensive (often 4000+), mid-range phones have compromised specs, system ads and lack of freedom
This group was overlooked by mainstream manufacturers—Apple pursued "simple and easy" not needing enthusiasts, Samsung and Huawei pursued "mass market" not valuing geek needs.
Strategy Implementation Driven by Audience Analysis:
-
Product Strategy: High specs low price (1999 yuan flagship specs), MIUI deeply customizable (weekly updates), Root permissions open, clean system without ads. Perfectly matches enthusiasts' tech needs.
-
Community Operations: Built Xiaomi forums, encouraged users to report bugs, suggest features, participate in development. "Born for enthusiasts" wasn't just slogan, but product philosophy. Core users weren't just buyers, but "co-creators."
-
Communication Strategy: Zero ad budget, entirely word-of-mouth. Core enthusiasts became "organic promoters," spontaneously spreading in tech circles. Lei Jun's personal IP ("Lei Bu Si") built emotional connection with fans.
-
Pricing Strategy: Extreme value for money, online-offline same price, hunger marketing creating scarcity. Matches enthusiasts' "knowledgeable, value-pursuing" psychology.
Customer Success Data:
- 0-1 Stage (2011-2013): From 0 to 30 billion yuan annual revenue, 1 million core fans
- Customer Acquisition Cost: CAC < 10 yuan (traditional phone brand CAC > 200 yuan)
- Repurchase Rate: Mi Fan repurchase rate reached 75% (industry average < 40%)
- Recommendation Rate (NPS): Reached 70+ (industry average 30-40)
- Lifetime Value: Mi Fans average 3.5 Xiaomi devices purchased (industry average 1.8)
Strategic Evolution:
As brand developed, Xiaomi gradually expanded from enthusiasts to mass market, but "high performance, high value" core positioning remained consistent. Each stage had clear audience analysis support:
- 2011-2013: Focus on enthusiasts, establish brand trust
- 2014-2016: Expand to young demographics, "national phone" positioning
- 2017-2020: Enter mid-high end market, Xiaomi/Redmi dual-brand
- 2021-present: AIoT ecosystem, covering full-scenario user needs
Key Insights:
- Early focus on niche is essential for breaking through: Better to find overlooked blue ocean niche than compete in red ocean
- Community operations are continuous source of audience analysis: Deep user feedback more real and timely than research
- Fan economy built on emotional connection: Beyond buyer-seller relationship, establish "we're the same kind of people" identification
- From niche to mass needs strategic pacing: First become #1 in niche, then gradually expand adjacent markets
Case 2: Pinduoduo's Social Viral—Revolution of Lower-Tier Market User Insights
Background and Challenge: Pinduoduo founded in 2015, when e-commerce already monopolized by Alibaba (Tmall/Taobao) and JD. Alibaba主打 "versatile Taobao" (all categories), JD主打 "authentic quality" (logistics experience), Pinduoduo needed differentiated positioning.
Audience Insight and Analysis Process:
Through data analysis and user research, Pinduoduo team discovered huge opportunity in "lower-tier market users":
- Demographics: Third- and fourth-tier cities and rural areas, 25-45 year old females, monthly income 2000-6000 yuan, price-sensitive
- Behaviors: Heavy WeChat users, trust acquaintance recommendations, like group buying and bargaining, less brand-sensitive
- Psychographics: Pursue psychological satisfaction of "getting deals," enjoy social interaction fun, sense of achievement from "successful group buy"
- Core Pain Points: Worry about buying too expensive (price comparison needs), worry about fake goods (trust needs), unfamiliar with complex shopping processes (simplicity needs)
This group's characteristics were overlooked by traditional e-commerce platforms—Alibaba pursued "versatility" ignoring social needs, JD pursued "quality" ignoring price-sensitive demographics.
Strategy Implementation Driven by Audience Analysis:
-
Product Strategy: Extremely simplified shopping process (one-click purchase within WeChat), group bargaining mechanism (social viral), low-price explosive products (9.9 free shipping), "10 billion subsidies" establish trust (brand products at low prices).
-
Communication Strategy: Viral spread based on WeChat social graph. Users actively share to friends for "bargaining" or "group buy." Each user becomes传播 node, extremely low CAC.
-
Trust Building: Through "10 billion subsidies" introduce Apple, Dyson and other big brands, proving "not a fake goods platform." User review system strengthens social proof.
-
Algorithmic Recommendation: Personalized recommendation based on social graph and purchase behavior, not search-oriented. Matches lower-tier market users' "browse" not "search" habit.
Customer Success Data:
- User Growth: 3 years from 0 to 300 million active users (Taobao took 10 years)
- Customer Acquisition Cost: Early CAC < 5 yuan (traditional e-commerce CAC > 100 yuan)
- Conversion Rate: Group buy model conversion rate 15-20% (traditional e-commerce 2-3%)
- Average Order Value and Frequency: Low AOV (30-50 yuan), but high frequency (8-10 times monthly)
- GMV Growth: 2019 GMV broke 1 trillion, becoming second-largest e-commerce platform
Strategic Evolution:
- 2015-2017: Focus on lower-tier markets, establish "low price + social" perception
- 2018-2020: First- and second-tier city penetration (10 billion subsidies), "within 5th Ring Road" demographic acquisition
- 2021-present: Agricultural products upward mobility (new brand plan), brand merchant introduction, quality upgrade
Key Insights:
- Social graph is strongest传播 engine: User trust chains more effective than advertising
- Price-sensitive ≠ quality-insensitive: Lower-tier market users also want good goods, but at affordable prices
- Simplified process is conversion rate key: Lower decision barriers, make "impulse purchase" easier
- Trust is long-term moat: Early acquire users with low prices, later retain with brand and quality
Case 3: Douyin Algorithmic Recommendation—Gen Z Content Consumption Insights
Background and Challenge: Douyin (launched 2016) faced competition from Kuaishou (lower-tier market first-mover), Weibo (celebrity content), Tencent Video (long video). Needed differentiated positioning and user value proposition.
Audience Insight and Analysis Process:
Through user behavior data analysis and content preference research, Douyin identified core needs of "Gen Z content consumers":
- Demographics: 15-30 years old, both first-tier and lower-tier markets, mainly students and workplace newcomers
- Behaviors: Fragmented attention (< 15 second videos), high-frequency refresh (1-2 hours daily), like interactions (likes, comments, sharing), strong conformity (trending topic following)
- Psychographics: Pursue participation of "being seen" (UGC creation), enjoy belonging of "finding like-minded people," satisfy instant gratification dopamine needs
- Core Pain Points: Don't know what to watch (choice difficulty), uneven content quality (high screening cost), want to participate but can't create (barrier issue)
This insight differed from mainstream platform perceptions then—Kuaishou emphasized "recording life," Weibo emphasized "following celebrities," Douyin focused on "algorithmic recommendation + lowered creation barrier."
Strategy Implementation Driven by Audience Analysis:
-
Algorithmic Recommendation Core: Personalized recommendation based on user behavior (dwell time, interaction, completion rate), not following relationships. Users "swipe" to content algorithm thinks they'll like.
-
Creation Tool Simplification: Beauty filters, music library, special effects props, templates one-click apply. Let ordinary users also "create blockbusters in 15 seconds," lowering creation barrier.
-
Content Ecosystem Strategy: Early introduce influencers and MCN agencies (content supply), incentivize UGC creation (challenge competitions, duets), algorithm support new creators (decentralized traffic distribution).
-
Commercialization Path: From brand advertising to live streaming commerce (short conversion path), creator incentive programs (platform-creator win-win), DOU+ tools (users can buy traffic).
Customer Success Data:
- User Growth: 2017 DAU 10 million → 2020 DAU 600 million (3 years, 60x growth)
- User Stickiness: Daily usage time exceeds 100 minutes (industry highest)
- Content Supply: Daily video uploads tens of millions, creators over 400 million
- Commercialization: 2020 ad revenue over 180 billion, becoming one of largest ad platforms
- Live Streaming E-commerce: 2021 GMV broke 1 trillion, transformation from content platform to e-commerce platform
Strategic Evolution:
- 2016-2017: Tool positioning (short video shooting and editing tool)
- 2018-2019: Content community (algorithmic recommendation + creation ecosystem)
- 2020-2021: Full-platform (video + social + e-commerce + local life)
- 2022-present: Interest e-commerce (content-driven consumption, from "people find goods" to "goods find people")
Key Insights:
- Algorithmic recommendation is core to user retention: Personalized content more precise than social recommendations
- Lowering creation barrier is key to content supply: Anyone can create, infinite content
- User behavior data is most real insight: Dwell time > likes, completion rate > click rate
- Shorten path from content to consumption: See something want to buy, purchase immediately without jumping
Case 4: Perfect Diary Private Domain Operations—Deep Connection with Young Female Consumers
Background and Challenge: Perfect Diary founded 2017, beauty market dominated by international brands (Estée Lauder, L'Oreal) and established domestic brands (Chando, Pehchaolin). Needed differentiated positioning and user connection methods.
Audience Insight and Analysis Process:
Through user research and social media monitoring, Perfect Diary identified characteristics of "post-95s beauty consumers":
- Demographics: 18-28 year old females, mainly first- and second-tier cities, students and workplace newcomers, monthly disposable income 1000-3000 yuan
- Behaviors: Heavy Xiaohongshu, Bilibili, Douyin users, trust KOL/KOC recommendations, like trying new things and following trends, have some knowledge of ingredients and efficacy
- Psychographics: Pursue "refined life" self-expression, enjoy "being discovered" social recognition, satisfy "dupe for big brands" value needs
- Core Pain Points: Don't know how to choose (too many products), worry about bad buys (high trial cost), limited budget (can't afford big brands), lack professional knowledge (don't know how to apply makeup)
This insight differed from traditional beauty brand perceptions—big brands emphasized "classic formulas," old domestic brands emphasized "value," Perfect Diary focused on "social传播 + private domain operations."
Strategy Implementation Driven by Audience Analysis:
-
Product Strategy: Rapid iteration (monthly new launches), follow trends (collaborations, holiday limited editions), value pricing (50-150 yuan), big brand dupes (ingredients match but 1/10 price).
-
KOL/KOC Communication: Xiaohongshu seeding (mass KOC authentic reviews), Bilibili tutorials (beauty influencer usage tutorials), Douyin viral hits (challenge competitions, duets). Not celebrity endorsement, but "ordinary user recommendations."
-
Private Domain Operations Core: Every offline purchase user guided to WeChat group ("Xiao Wan Zi" personal account), WeChat groups continuous content output (tutorials, promotions, interactions), WeChat Moments precision marketing (user tagging), mini-program repurchase convenience (membership system, points redemption).
-
Data-Driven Product: Rapid product iteration based on private domain user feedback, develop new products based on community discussion hot topics (user co-creation).
Customer Success Data:
- Growth Speed: 2 years from 0 to 3 billion+ annual sales (became Tmall Beauty TOP1)
- Repurchase Rate: Private domain user repurchase rate 40%+ (industry average 20%)
- Customer Acquisition Cost: CAC approximately 50-80 yuan (traditional brand CAC > 200 yuan)
- User Lifetime Value: LTV approximately 400-600 yuan (LTV/CAC > 5)
- Private Domain Scale: Serve millions of private domain users, thousands of communities
Strategic Evolution:
- 2017-2018: Online DTC model, Tmall/Xiaohongshu focus
- 2019-2020: Offline store expansion (experience stores + private domain guidance)
- 2021-present: Multi-brand strategy (Perfect Diary/Abbot/Skin management, etc.), internationalization layout
Key Insights:
- Private domain is core brand asset: Master user data for long-term operations
- KOC more authentic than KOL: Ordinary user recommendations more persuasive than celebrity endorsements
- Rapid iteration is core capability: Quickly adjust products and strategies based on user feedback
- From traffic to retention: Not just acquiring new users, but cultivating existing user value
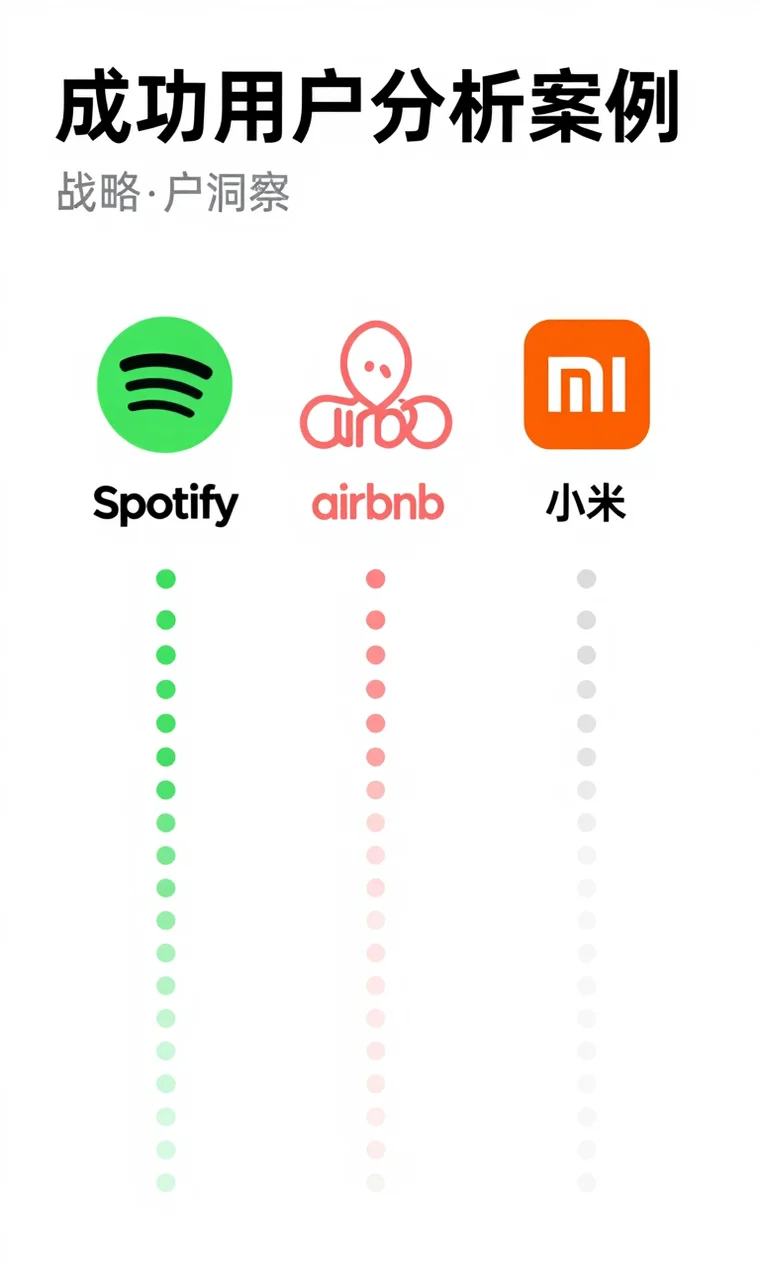 Figure 3: Four Major Chinese Brand Audience Analysis Cases—Success Paths from Niche Markets to Full-Scope Growth
Seven Audience Analysis Methods: From Foundation to Advanced
Method 1: Demographic Analysis
Core Concept: Identify basic characteristics of target users through quantifiable demographic data. This is foundational level of user personas, but must dig deeper to be effective.
Implementation Steps:
- Data Collection: Obtain demographic data through CRM systems, user registration information, third-party data platforms (Tencent Big Data, Baidu Index)
- Segmented Analysis: Cross-analyze users by age, gender, region, income, occupation, etc., find high-value combinations
- Trend Identification: Observe changes in user demographic structure trends (age shifting up, regional expansion, income increase)
Chinese Market Special Considerations:
- City Tier Stratification: First-tier (Beijing Shanghai Guangzhou Shenzhen) vs New First-tier (Hangzhou Chengdu Wuhan) vs Second/Third-tier vs Lower-tier markets (county towns/townships)
- Generational Differences: Post-70s (pragmatism), Post-80s (quality pursuit), Post-90s (self-expression), Post-00s (tribal culture)
- Regional Culture: North (conservative steady) vs South (open diverse), Coastal (international vision) vs Inland (traditional values)
Application Scenarios: Early brand positioning, market entry strategy, ad targeting
Common Mistakes: Over-reliance on demographics, ignoring value differences within same age/gender groups. Solution: combine with psychographic analysis.
Method 2: Behavioral Data Analysis
Core Concept: Understand user real needs and preferences through actual behavior data (not self-reporting). Behavior doesn't lie.
Key Data Metrics:
- Acquisition Behavior: Where from (traffic source), how discovered (search/recommendation/share)
- Engagement Behavior: Click heatmaps, page paths, dwell time, scroll depth, video completion rate
- Conversion Behavior: Add-to-cart rate, order rate, payment completion rate, repurchase interval
- Retention Behavior: Day 1 retention, Day 7 retention, Day 30 retention, churn points
Implementation Tools:
- Website Analytics: Google Analytics, Baidu Statistics, Sensors Data, GrowingIO
- App Analytics: Umeng+, TalkingData, Firebase Analytics
- User Behavior Recording: Hotjar, Clarity (screen recording), Mixpanel (event tracking)
Data-Driven Insights:
- High-value users typically visit 3+ times weekly, view average 5 pages
- Peak conversion periods: 2-4 PM and 8-10 PM
- Mobile conversion rate 20% lower than PC, but traffic is 3x
- Users average 5-7 touchpoints from first visit to purchase
Method 3: Psychographic Analysis
Core Concept: Deeply understand user values, lifestyles, personality traits, purchase motivations, and emotional needs. This is deepest and most important analysis dimension.
Analysis Dimensions:
- Values: What users consider important (e.g., "quality first" vs "value priority," "innovative edgy" vs "classic traditional")
- Lifestyle: How users live and work (e.g., "busy professional" vs "freelancer," "family-oriented" vs "self-actualization")
- Personality Traits: Big Five personality (openness, conscientiousness, extraversion, agreeableness, neuroticism)
- Purchase Motivations: Functional needs, emotional needs, social needs, self-actualization needs (Maslow's hierarchy)
Implementation Methods:
- In-Depth Interviews: 1-on-1 interviews 60-90 minutes, explore "why" not "what"
- Projection Techniques: Have users create stories, metaphors, or images for brands/products, project subconscious
- Emotion Curves: Track user emotional changes during usage (anticipation→excitement→anxiety→satisfaction)
- Values Scales: Use standardized psychology scales (LOV Values Scale, Schwartz Values Questionnaire)
Chinese Market Insights:
- Face Consumption: Purchase decisions often consider social display and others' evaluations
- Conformity Psychology: Hot products, sales data, user reviews are important decision factors
- Value Culture: Not pursuing "cheapest," but "value for money"
- Relationship Orientation: Trust acquaintance recommendations, KOC more persuasive than KOL
Method 4: Contextual Analysis
Core Concept: Understand in what scenarios, timings, circumstances users generate needs and use products. Scenarios are具体ization of needs.
Analysis Framework: 5W1H
- Who: Who is using? (user role)
- When: When using? (time, timing)
- Where: Where using? (location, environment)
- What: What task to complete? (goal, need)
- Why: Why need this scenario? (motivation, trigger)
- How: How complete task? (behavior path, tools)
Scenario Types:
- Usage Scenarios: Commute, office, home, outdoor, social occasions
- Purchase Scenarios: Urgent need, planned purchase, impulse buy, gift giving
- Decision Scenarios: Individual decision, family discussion, friend recommendation, expert advice
Scenario Insight Applications:
- Commute scenario (fragmented time) → Product needs quick launch, offline available
- Home scenario (multiple users) → Product needs account switching, permission management
- Social scenario (party sharing) → Product needs one-click share, photo beautification
- Late night scenario (alone time) → Product needs immersive experience, emotional resonance
Method 5: Customer Journey Mapping
Core Concept: Visualize complete process from user awareness of need to purchase completion (and subsequent usage), identify pain points, opportunities, and key decision points at each stage.
Typical Journey Stages:
-
Awareness Stage: User realizes have need or problem
- Triggers: Work needs, life scenarios, social influence, ad exposure
- User thinking: "What problem do I need to solve?"
-
Consideration Stage: User seeks solutions
- Information channels: Search engines, social media, friend recommendations, e-commerce platforms
- User behaviors: Compare options, read reviews, watch videos, consult customer service
- User thinking: "What are the choices? Which suits me better?"
-
Decision Stage: User makes purchase decision
- Decision factors: Price, features, reviews, brand trust, promotions
- Purchase barriers: Price concerns, trust issues, decision pressure, payment difficulties
- User thinking: "Should I buy? Buy now?"
-
Purchase Stage: User completes transaction
- Experience elements: Checkout process, payment methods, delivery speed, unboxing experience
- User expectations: Simple fast, safe reliable, instant gratification
-
Usage Stage: User actually uses product
- Experience elements: Feature satisfaction, usability, stability, customer support
- Value realization: Did it solve the original problem?
-
Advocacy Stage: User willingness to recommend
- Recommendation motivations: Exceed expectations, identity recognition, social currency, incentive
- Recommendation behaviors: Word-of-mouth, social sharing, writing reviews, repurchase
Journey Insight Value:
- Identify drop-off points (where users abandon)
- Discover emotional valleys (where users anxious/frustrated)
- Find key moments (critical touchpoints affecting decisions)
- Optimize resource allocation (prioritize improving most impactful stages)
Method 6: Competitive User Analysis
Core Concept: Through analyzing competitors' user groups and strategies, quickly identify market gaps and differentiation opportunities.
Analysis Dimensions:
-
Competitor User Personas:
- Who follows competitors? (fan personas, commenter characteristics, buyer characteristics)
- How do users evaluate competitors? (positive points, negative points, unmet needs)
- How do users use competitors? (usage scenarios, product combinations, innovative uses)
-
Competitor Communication Strategies:
- How do competitors describe users? (official website copy, ad content, social media)
- Through what channels do competitors reach users? (ad placement, KOL partnerships, PR strategies)
- What language do competitors use to communicate with users? (copy style, keywords, emotional appeals)
-
Market Gap Identification:
- User groups overlooked by competitors (demographics or psychographics)
- User needs unmet by competitors (pain points, scenarios, expectations)
- Competitor weaknesses (product, service, experience, price)
Implementation Tools:
- Social Monitoring: Competitor mentions and user reviews on Weibo, Xiaohongshu, Zhihu
- Ad Monitoring: AppGrowing, DataEye (competitor ad placement data)
- E-commerce Analysis: Tmall/JD competitor store data, user review analysis
- User Research: Ask in user interviews "What other brands did you consider? Why choose us?"
Method 7: Data-Driven User Segmentation
Core Concept: Use machine learning and clustering algorithms to automatically identify behavioral patterns and segments based on massive user data, not relying on subjective assumptions.
Technical Methods:
- Cluster Analysis: K-means, hierarchical clustering, divide users into similar groups
- RFM Analysis: Segment by Recency (last purchase), Frequency (purchase frequency), Monetary (purchase amount)
- Behavioral Tagging: Tag users based on behaviors (e.g., "price-sensitive," "quality-seeking," "socially active")
- Lifecycle Stage: New, active, dormant, churned users
Segmentation Dimensions:
- Value Dimension: High-value, mid-value, low-value, negative-value users
- Behavior Dimension: Heavy, medium, light, potential users
- Need Dimension: Functional-needs, emotional-needs, social-needs, self-actualization-needs
- Channel Dimension: Online, offline, omnichannel users
Application Scenarios:
- Precision marketing (different segments see different ad content)
- Differentiated pricing (price-sensitive users see coupons, quality-seekers see membership perks)
- Product recommendation (recommend products based on similar user behaviors)
- Customer service strategy (high-value users get VIP service, churn-risk users get retention offers)
Implementation Tools:
- Data Analytics Platforms: Tableau, Power BI, Qlik Sense
- User Behavior Analytics: Mixpanel, Amplitude, Sensors Data
- Machine Learning Platforms: AWS SageMaker, Alibaba Cloud PAI, Tencent Cloud TI
Chinese Consumer Persona Tools: From Theory to Practice
First-Tier City New Professional Persona
Basic Information:
- Age: 25-35
- Region: Beijing Shanghai Guangzhou Shenzhen Hangzhou new first-tier city CBD areas
- Occupation: Internet/finance/professional services (lawyers, consultants, doctors)
- Income: Monthly 15,000-50,000 yuan
Behavioral Characteristics:
- Fast work pace, often overtime (996 is norm)
- Highly dependent on mobile internet, smartphone is organ
- Information channels: 36Kr,虎嗅, Zhihu, WeChat Moments
- Shopping channels: Tmall, JD, Hema, Dingdong Fresh
- Social platforms: WeChat (work), Weibo (trending), Xiaohongshu (seeding), Bilibili (learning)
Psychographic Motivations:
- Pursue "work-life balance" but hard to achieve
- Value quality and efficiency, willing to pay to "save time"
- High anxiety: Career development, financial freedom, health and wellness
- Strong self-actualization needs: Learning improvement, side hustles, knowledge payment
Brand Preferences:
- Value brand背后 values (environmental, public welfare, innovation)
- Like niche designer brands, new domestic brands
- Low loyalty, willing to try new products but return to rationality
Marketing Reach Strategy:
- Content marketing: Deep articles, industry reports, knowledge sharing
- KOL collaboration: Industry experts, opinion leaders, workplace bloggers
- Scene marketing: Subway ads (commute scenario), office elevators, cafes
- Promotion strategy: Membership systems, points benefits, limited editions
Lower-Tier Market Pragmatic Family Persona
Basic Information:
- Age: 28-45
- Region: Third- and fourth-tier cities and county towns
- Occupation: Small business owners, civil servants, teachers, self-employed
- Income: Family monthly income 8,000-20,000 yuan
Behavioral Characteristics:
- Relatively slow life pace, value family life
- Information acquisition: WeChat Moments, Toutiao, Kuaishou, Douyin
- Shopping channels: Pinduoduo, local supermarkets, live streaming commerce
- Social platforms: WeChat (family groups), Kuaishou (entertainment), Pinduoduo (shopping)
- Payment habits: WeChat Pay mainly, habit of try-then-buy
Psychographic Motivations:
- Pursue "value" and "cost-performance," not "cheapest"
- Value family responsibilities (children's education, parents' health, family meals)
- Trust acquaintance recommendations, believe "everyone is buying"
- Enjoy psychological satisfaction of "getting deals" (bargaining, group buying, coupons)
Brand Preferences:
- High trust in big brands (Haier, Gree, Midea)
- Low acceptance of new brands, need social proof (sales, reviews, friend recommendations)
- Interested in "novel" products but cautious trying
Marketing Reach Strategy:
- Social viral: Group buying, bargaining, referral fission
- Trust building: User reviews, sales data, brand endorsement
- Channel penetration: Community group buying, village agents, ground promotion
- Promotion strategy: Limited-time flash sales, full-reduction discounts, gift strategies
Gen Z Tribal Youth Persona
Basic Information:
- Age: 15-25
- Region: Mainly first- and second-tier cities, rapidly penetrating lower-tier markets
- Identity: High school students, university students, workplace newcomers
- Spending power: Disposable monthly income 1000-5000 yuan (including parent support)
Behavioral Characteristics:
- Digital natives, grew up with internet and smartphones
- Fragmented attention, 15-second videos is norm
- Content creation: Like UGC (user-generated content), desire to be seen
- Social mode: Tribal culture (Hanfu circle, ACG circle, e-sports circle, hip-hop circle)
- Information acquisition: Bilibili, Xiaohongshu, Douyin, Weibo super topics
Psychographic Motivations:
- Pursue "self-expression" and "identity recognition" (what kind of person am I)
- Enjoy "instant gratification" (scrolling videos, gaming, instant feedback)
- Value "social currency" (can share, can show off, can represent taste)
- Strong identification with "national trend culture" (Huawei, Li-Ning, Florasis)
Brand Preferences:
- Like emerging brands (Genki Forest, Heytea, Perfect Diary)
- Value brand stories and values (environmental, public welfare, innovation)
- Loyalty builds quickly, but also easy to switch to trendier brands
- Willing to pay premium for "aesthetics" and "experience"
Marketing Reach Strategy:
- Content co-creation: UGC challenge competitions, user submissions, bullet screen interaction
- Tribal marketing: ACG collaborations, Hanfu events, e-sports sponsorship
- KOC seeding: Ordinary user recommendations more authentic than celebrity endorsements
- Gamified operations: Check-ins, lucky draws, leaderboards, virtual rewards
Middle-Class Quality Seeker Persona
Basic Information:
- Age: 30-45
- Region: First- and second-tier city middle-class communities
- Occupation: Corporate mid-senior level, professionals (doctors, lawyers, university professors)
- Income: Family monthly income 30,000-100,000 yuan
Behavioral Characteristics:
- Stable work, value quality of life
- Information acquisition: Professional media, industry reports, high-end magazines
- Shopping channels: Tmall flagship stores, JD, Sam's Club, overseas personal shoppers
- Social platforms: WeChat (curated Moments), LinkedIn, Zhihu
- Consumption habits: Willing to pay for quality and service, concerned about health and environment
Psychographic Motivations:
- Pursue "refined life" and "self-improvement"
- Value brand背后 human stories and craftsmanship
- Anxiety: Children's education, health management, retirement planning
- Identity recognition: "I'm a person with taste and pursuits"
Brand Preferences:
- International big brands (Apple, Dyson, BMW)
- Premium domestic brands (Huawei, Haier, Li-Ning)
- Niche designer brands, handicrafts
- High loyalty, strong repurchase
Marketing Reach Strategy:
- Quality marketing: Emphasize materials, craftsmanship, design philosophy
- Experience marketing: Offline experience stores, membership-exclusive events
- Content marketing: Deep articles, documentaries, brand stories
- Service marketing: VIP service, customization, dedicated consultants
Common Audience Analysis Mistakes and Solutions
Mistake 1: Over-Reliance on Demographics, Ignoring Psychographics
Problem Manifestations:
- User personas only停留在 "25-35 year old females, first-tier cities, monthly income 10-20k"
- Can't explain why same target users, some buy some don't
- Marketing content "generic," can't resonate
Real Case: A skincare brand defined target users as "25-35 urban females," found extremely low conversion after ad placement. Deep interviews found this age group's values completely different:
- Type A: Pursue value, think "good enough is fine," unwilling to pay brand premium
- Type B: Pursue quality, believe "you get what you pay for," willing to pay for good products
- Type C: Pursue safety, worry about additives and side effects, prefer natural organic
After brand adjusted strategy for Types B and C, conversion rate increased 3x.
Solutions:
- Dig Deep into "Why": Not just know "what users bought," but understand "why they bought"
- Psychographic Analysis: Use values scales, deep interviews, projection techniques
- Motivation Segmentation: Segment by purchase motivation (value/quality/safety/status), not age/gender
- A/B Testing Validation: Design different marketing content for different motivation groups, test effectiveness
Mistake 2: Trying to Serve Everyone, Blurry Positioning
Problem Manifestations:
- Brand claims "suitable for everyone," "all ages"
- Feature bloat, does everything but nothing excellent
- Marketing message模糊, users can't remember what brand stands for
Real Case: A maternal-child brand initially positioned "all families with children," products from formula, diapers to toys, children's clothing all made. Result:
- Product line too long, can't ensure every product quality
- User perception confused, don't know brand core value
- No advantage vs competitors focused on niche segments (organic formula, diapers)
After pivoting to focus "premium organic formula," positioned "quality-conscious middle-class families," market share increased 200% within one year.
Solutions:
- Accept "Can't Serve Everyone": Actively choose most valuable, most brand-value-movable segments
- Early Focus: With limited resources, focus on 1 segment to extreme, then expand adjacent markets
- Clarify "For Whom, Solve What Problem": Brand positioning statement must be clear, avoid vague expressions
- Strategic Pacing: Enter from niche market → establish leadership → gradually expand (reference Xiaomi, Pinduoduo path)
Mistake 3: One-Time Analysis, Never Update, Outdated Insights
Problem Manifestations:
- Treat user analysis as "project" not "continuous process"
- User personas created a year ago, still using but inaccurate
- Decisions based on outdated insights completely deviate from real user needs
Real Case: A SaaS brand 2020 user personas showed "SME owners, 45-55 year old males, habit phone communication." 2023 still designed products and marketing by this persona, but actual users changed to "30-40 years old, prefer online customer service, self-service." Result:
- Product features complex, don't match young user habits
- Marketing channels (telesales) inefficient
- Churn rate rising, CAC soaring
After re-analysis, simplified product UI, added self-service, marketing shifted to Douyin/Bilibili, CAC decreased 40% in six months.
Solutions:
- Regular Review Cadence: Recommend quarterly review of key metrics, semi-annual comprehensive persona update
- Continuous Data Monitoring: User behavior data, social media trends, competitor movements
- Establish Feedback Mechanisms: Regular user interviews, NPS surveys, customer service data analysis
- Update Trigger Conditions: Must update when launching new products, entering new markets, user structure significantly changes
Mistake 4: Insights Disconnected from Decisions, Analysis Becomes Decoration
Problem Manifestations:
- Spend huge resources on user analysis, create detailed persona documents
- But actual decisions completely ignore: "We know user personas, but we want to do this feature"
- Marketing budget allocation based on boss preference or channel convenience, not user insights
Real Case: A brand spent 500k on user research, identified core users as "quality-seeking middle-aged women." But new product development, product manager designed many cool features young people like for "innovation." Result:
- Core users felt product became "hard to use"
- Target young users didn't buy (had better choices)
- Pleased neither, product failed
Solutions:
- Decision Review Mechanism: Explicitly reference user personas in important decisions, deviations need strong justification
- Visual Display: User persona posters in meeting rooms and offices, constant reminder
- Cross-Departmental Alignment: Product, marketing, sales, customer service have consistent understanding of user personas
- Incentive Alignment: Include user satisfaction, NPS in team KPIs
Mistake 5: Over-Reliance on Tools, Ignoring Human Judgment
Problem Manifestations:
- Think buying user analytics tools (Mixpanel, Sensors Data) solves everything
- Pretty data visualization, but lack deep insights
- Over-rely on algorithmic recommendation, ignore real user voices
Real Case: An e-commerce brand relied on recommendation algorithm ("people who bought this also bought..."), sales short-term up but long-term down. Data analysis found:
- User purchases homogenized, lack personalization
- Long-tail products ignored, richness decreased
- Users felt "controlled by algorithm," churn rate rising
After introducing human curators and user feedback, algorithm + human combination, sales and satisfaction both increased.
Solutions:
- Tools Assist Not Replace: Tools provide data, humans provide insights
- Qualitative + Quantitative: Data analysis + user interviews, algorithm recommendation + human review
- Maintain Skepticism: Data tells us "what," but not necessarily "why"
- User Feedback Priority: Regularly talk to real users, validate data insights
Mistake 6: Copy Competitor Strategy, Lack Differentiation
Problem Manifestations:
- User personas highly similar to competitors: "Our target users same as XX brand"
- Marketing strategy imitates competitors, fall into homogeneous competition
- Can't establish brand differentiation, users don't remember you
Real Case: A new tea beverage brand defined target users as "young people who like milk tea," completely overlapping with Heytea and Nayuki. Result:
- Products, pricing, channels identical to competitors
- Why choose you over more mature brands?
- High CAC, low retention
After re-analysis, found "young people who like milk tea" can be further segmented:
- Heytea: Social check-in crowd (queueing, photos, sharing)
- Nayuki: Refined life crowd (space experience, third place)
- This brand: Functional need crowd (health, energy boost, meal replacement)
After focusing "health functional tea drinks," established differentiated positioning, revenue up 150% in six months.
Solutions:
- Competitor Analysis ≠ Copy Competitors: After understanding competitor strategy, find unmet niches
- Differentiated Segmentation: Discover "niche" needs in mass market
- Unique Value Proposition: Clarify "what unique value we provide for whom"
- Validate Differentiated Market Space: Are there enough users? Will they pay?
Mistake 7: Ignore Cultural Differences and Regional Specificities
Problem Manifestations:
- Copy foreign brand user personas and analysis methods
- Ignore Chinese market peculiarities (culture, consumption habits, social patterns)
- Use same strategy across different regions, poor results
Real Case: An international brand entered China, directly used US user personas ("middle-class families, value environment and sustainability"). Invested huge marketing budget with poor results. Research found:
- Chinese middle class more care about "quality and safety" not "environment"
- Different trust channels: US trusts third-party reviews, China trusts acquaintance recommendations and KOLs
- Purchase decision differences: US individual decision, China family discussion
After adjustment, focused on "quality assurance" (brand endorsement), "social传播" (KOL seeding), "family decision" (family-sized products), conversion rate up 4x.
Solutions:
- Localized User Research: Re-do user analysis in Chinese market, not copy HQ data
- Understand Cultural Differences: Face culture, conformity psychology, relationship orientation, family values
- Regional Difference Considerations: First-tier vs lower-tier markets, North vs South, Coastal vs Inland
- Trust System Building: Build trust according to Chinese market characteristics (brand endorsement, social proof, authoritative certification)
FAQ: Common Questions (20 Questions)
Basic Concepts and Methods
Q1: What is a user persona? What core elements should it include?
A user persona is a fictional user representative created from real user data, helping teams understand and empathize with target users. Effective user personas should include:
Basic Information: Age, gender, occupation, income, city, family status, and other demographic data Core Goals: What users want to achieve (e.g., "improve work efficiency," "improve family relationships") Main Pain Points: What problems users encounter (e.g., "wasting time," "worry about safety") Purchase Motivation: Why choose you (functional, emotional, social, self-actualization needs) Decision Factors: What considered when making choices (price, quality, convenience, brand trust) Information Channels: Where get information (social media, search engines, friend recommendations) Language Preferences: How describe needs and evaluate products (users' actual quotes) Usage Scenarios: In what circumstances use (commute, office, home, social) Typical Day: Life and work rhythm (time allocation, priorities, pressure points) Real Quotes: Users' original words (add authenticity and memorability)
Creation recommendations: Start from real user data (not subjective imagination), each persona focus on one segment (avoid "universal persona"), name persona and add photo (increase memorability), use storytelling language (not list data), limit to 3-5 personas (cover 80% core users).
Q2: What's the difference between target audience analysis and market research?
Related but fundamentally different:
Market Research:
- Broader scope, studies entire market (market size, growth trends, competitive landscape)
- Usually project-based, one-time or periodic
- Output: Market reports, industry analysis, competitive comparisons
- Decision level: Strategic direction, market entry, product line planning
Target Audience Analysis:
- Deeper scope, focuses on "your" core user groups
- Continuous, needs regular updates and validation
- Output: User personas, user journeys, insight reports
- Decision level: Product features, marketing content, brand positioning, user experience
Market research answers "how big is the market," target audience analysis answers "who's most likely to buy and stay loyal to you." Best used in combination.
Q3: What's different about B2B vs B2C user analysis?
B2B User Analysis Characteristics:
- Dual Levels: Need to analyze "organization" (company size, industry, decision process) and "individual" (decision-makers, users, influencers)
- Long Decision Cycle: From need identification to final signing may take 3-12 months
- Multiple Decision Participants: C-level decision, department head recommendation, IT evaluation, finance approval
- Rational Orientation: Focus on ROI, TCO (Total Cost of Ownership), risk control, compliance
- Trial Validation: Usually need POC (Proof of Concept) or trial period
- High Value Low Frequency: High AOV but low repurchase frequency
B2C User Analysis Characteristics:
- Individual Level: Focus on individual psychology and emotional needs
- Short Decision Cycle: From awareness to purchase may take minutes to days
- Individual or Family Decision: Usually individual decision or family discussion
- Emotional Orientation: Focus on identity recognition, social display, instant gratification
- Impulse Purchase: Easily influenced by ads, promotions, KOLs
- Low Value High Frequency: Low AOV but high repurchase frequency
Implementation recommendations: B2B needs identify key decision-makers and purchase process, B2C needs understand emotional motivations and social influence. Both need deep user insights, but analysis methods and application scenarios differ.
Implementation and Cost
Q4: How to do user analysis with low budget/startups?
Low-budget businesses have multiple low-cost user analysis methods:
Existing Data Mining (Cost: 0 yuan):
- Website analytics data (Google Analytics, Baidu Statistics)
- Sales data and CRM records
- Customer service records and FAQs
- Social media interaction data
User Interviews (Cost: 500-2000 yuan):
- 5-10 deep interviews yield huge insights
- Can be phone or video, no need offline
- No cash payment needed, small gifts or product trials suffice
- Each interview 60-90 minutes, deeply explore "why"
Competitor Analysis (Cost: 0 yuan):
- Study competitor user reviews (Tmall, JD, App Store)
- Social media monitoring (Weibo, Xiaohongshu, Zhihu)
- Ad placement analysis (AppGrowing, DataEye free version)
- Quickly understand market expectations and user pain points
Online Surveys (Cost: 0-500 yuan):
- Free tools: Google Forms, QuestionStar basic, Tencent Questionnaire
- Distribute via social media, email, communities
- Can collect 100-500 valid samples
Community Operations (Cost: time):
- Build WeChat groups, Discord or QQ groups
- Directly communicate with core users
- Users will actively feedback problems and suggestions
Secondary Research (Cost: 0-500 yuan):
- Industry report summaries (iResearch, Analysys, QuestMobile free versions)
- Public data (National Bureau of Statistics, industry yearbooks)
- Academic papers (Google Scholar, CNKI)
Key recommendations: Start small, accumulate continuously, not pursue one-time "perfect research." Early insights from 10 deep interviews may be more valuable than 1000 surveys.
Q5: How long does user analysis take? When should it be done?
Time Cycle Reference:
Rapid Analysis (1-2 weeks):
- For: MVP validation, quick testing, new feature launches
- Methods: Existing data mining + 5-10 user interviews
- Output: Basic user personas, core insights
Standard Analysis (4-6 weeks):
- For: Brand positioning, product iteration, market entry
- Methods: Multi-data source analysis + 15-30 user interviews + competitor analysis
- Output: Detailed user personas, user journeys, strategy recommendations
Deep Analysis (2-3 months):
- For: Strategic transformation, new brand creation, major product重构
- Methods: Comprehensive research + 50+ user interviews + large-scale surveys + continuous validation
- Output: Complete insight system, multi-segment personas, prediction models
When Should It Be Done:
- When creating brand: Define target users and brand positioning
- New product development: Identify user needs and priorities
- Growth stagnation: Re-understand users, find breakthrough points
- Enter new markets: Understand new market user characteristics
- Regular review: Recommend quarterly review, semi-annual comprehensive update
Remember: User analysis isn't a one-time project, but continuous accumulation process. Early can do rapid analysis establish basic personas, then continuously iterate and optimize.
Q6: How to validate accuracy of user personas?
Multiple methods to validate user personas:
User Feedback Validation:
- Show personas to real users (especially high-value users)
- Ask: "Is this like you?", "Is description accurate?", "What's missing or wrong?"
- If users say "This is me," persona accurate
- If users say "Not like me," need adjust persona
Behavioral Data Comparison:
- Check if predicted behavior matches actual behavioral data
- For example: Persona predicts "price-sensitive," but data shows users buying high-price products
- Indicates persona有问题, needs correction
A/B Testing Validation:
- For same feature or marketing content, design two versions
- Version A based on persona A insights, version B based on persona B insights
- See which performs better (click rate, conversion rate, satisfaction)
- Data validation more reliable than subjective discussion
Predictive Accuracy Testing:
- Use persona to predict reaction to new product or marketing campaign
- Then validate actual results
- For example: Persona predicts "users will purchase 8-10 PM"
- Validate if actual sales data supports
Expert Review:
- Discuss with sales, customer service, operations frontline teams
- They know users best, intuition often accurate
- If they say "This doesn't look like our users," need pay attention
Competitor Comparison:
- If competitors also target similar users
- Their public insights and cases can provide validation
- For example: Competitor report shows "users value X feature," validate your insights
Remember: User personas are "hypotheses" not "truths," need continuous validation and iteration. When发现偏差, timely correction.
Data and Tools
Q7: What data needed for user analysis? How to obtain?
Quantitative Data Sources:
Website and App Analytics:
- Tools: Google Analytics, Baidu Statistics, Sensors Data, GrowingIO
- Data: Traffic sources, page browsing paths, dwell time, conversion rates, device types
- Obtain: Install analytics code, continuous automatic collection
CRM and Sales Data:
- Tools: Salesforce, HubSpot, Fxiaoke, SalesEasy
- Data: Purchase frequency, AOV, repurchase rates, lifetime value (LTV)
- Obtain: Export from CRM system
Social Media Data:
- Tools: WeChat backend, Weibo Data Center, Douyin business account backend
- Data: Fan personas, engaged content, forwards comments, topic heat
- Obtain: Platform built-in analytics functions
Third-Party Data Platforms:
- Tools: Tencent Big Data, Baidu Index, Alibaba Index, iResearch
- Data: Industry trends, user personas, competitor data
- Obtain: Purchase reports or use free versions
Qualitative Data Sources:
User Interviews:
- 1-on-1 deep interviews (60-90 minutes)
- Explore "why" not "what"
- Obtain deep motivations and emotional needs
Focus Groups:
- 6-8 person group discussions (2-3 hours)
- Observe user interactions and consensus/divergence
- Obtain real discussions among users
Surveys:
- Online or offline questionnaires
- Quickly collect large-scale quantitative and qualitative feedback
- Obtain statistical patterns of broad samples
Customer Service Records and Sales Feedback:
- Customer service chat logs, call recordings
- Sales daily logs, customer feedback
- Obtain user real problems and concerns
Social Media Monitoring:
- Monitor brand mentions, user reviews, competitor discussions
- Understand how users talk about brands in public
Competitor Analysis:
- Competitor user reviews, social media interactions
- Competitor ad content, communication strategies
- Quickly understand market expectations and differentiation opportunities
Data acquisition recommendations: Quantitative data provides "objective facts," qualitative data provides "deep reasons." Only combination provides complete user insights.
Q8: What user analysis tools recommended? How to choose?
Tool Classification and Recommendations:
Data Analytics Tools:
- Google Analytics (Free): Basic website analytics tool, powerful features
- Baidu Statistics (Free): Optimized for Chinese market, suitable for domestic websites
- Sensors Data (Paid): User behavior analytics, event tracking
- GrowingIO (Paid): Growth analytics, no-code tracking
- Mixpanel (Paid): Event analytics, user segmentation
User Research Tools:
- QuestionStar (Free+Paid): Online surveys, suitable for Chinese market
- Tencent Questionnaire (Free): Simple easy-to-use, WeChat ecosystem
- Typeform (Free+Paid): Beautiful survey design, great experience
- Calendly (Free+Paid): Schedule interview times
User Feedback Tools:
- Hotjar (Free+Paid): User recording, heatmaps, form analysis
- Microsoft Clarity (Free): User behavior recording, heatmaps
- UserEcho (Paid): In-app feedback entry, NPS surveys
Social Monitoring Tools:
- Weibo Data Center (Free): Weibo data analytics
- Xindou (Paid+Free): Douyin data analytics
- Chanmama (Paid+Free): Xiaohongshu data analytics
- Wujie Data (Paid): Full-media social monitoring
Competitor Analysis Tools:
- AppGrowing (Paid+Free): Ad placement monitoring
- DataEye (Paid): Mobile ad intelligence
- SimilarWeb (Free+Paid): Website traffic analytics
Data Visualization:
- Tableau (Paid): Powerful data visualization
- Power BI (Paid+Free): Microsoft, Office integrated
- Data Studio (Free): Google, integrated with Analytics
Tool Selection Recommendations:
- By Budget: Start with free tools (Google Analytics, Baidu Statistics, QuestionStar)
- By Needs: Clarify what to analyze (behavioral data, user feedback, competitors)
- By Technical Capability: Choose tools team can adopt, avoid over-complexity
- Integration: Consider data integration between tools, avoid data silos
Remember: Tools assist not replace. Tools provide data, humans provide insights. Don't fall into "tool worship," forgetting essence of user analysis is understanding people.
Chinese Market Specifics
Q9: What's special about Chinese market user analysis?
Cultural Differences:
- Face Consumption: Purchase decisions often consider social display and others' evaluation (e.g., cars, houses, luxury goods)
- Conformity Psychology: Hot products, sales data, "everyone buying" are important decision factors
- Relationship Orientation: Trust acquaintance recommendations, KOC (Key Opinion Consumers) more persuasive than KOLs
- Family Values: Purchase decisions often family discussion, not individual (especially high-value goods)
Social Platform Specifics:
- WeChat Ecosystem: Not just communication tool, but lifestyle (payment, shopping, services, social)
- Xiaohongshu Seeding: Users check Xiaohongshu reviews before decisions, trust real user shares
- Douyin/Kuaishou: Short video and live streaming commerce become important purchase channels
- Weibo Trending: Social hot topics and celebrity topics influence purchase decisions
Channel Complexity:
- Platform Diversity: Tmall, JD, Pinduoduo, Douyin e-commerce, WeChat mini-programs coexist
- New Retail: Online-offline fusion (Hema, Dingdong Fresh, community group buying)
- Lower-Tier Markets: Third- and fourth-tier city and rural shopping habits differ from first- and second-tier cities
Consumption Characteristics:
- Value Culture: Not pursuing "cheapest," but "value for money"
- Quality Pursuit: Middle class rise, willing to pay for quality and service
- National Trend: Young generation enhanced identification with domestic brands
- Rational Consumption: Price comparison, reviews, research become habit
Regional Differences:
- City Tiers: First, new first, second/third, lower-tier markets consumption capacity differ greatly
- North-South: North conservative steady, South open diverse
- Coastal vs Inland: Coastal high internationalization, Inland more traditional
Recommendations: In Chinese market, user analysis must be localized. Can't copy foreign methods, must combine Chinese user culture, habits, social patterns.
Q10: How to analyze first-tier vs lower-tier market users? What's different?
First-Tier City User Characteristics:
Demographics:
- Age: Mainly 25-40
- Occupation: Internet, finance, professional services
- Income: Monthly 15,000-50,000+ yuan
- Education: Bachelor and above
Behavioral Characteristics:
- Fast work pace, often overtime (996 is norm)
- Information acquisition: 36Kr, 虎嗅, Zhihu, LinkedIn
- Shopping channels: Tmall, JD, Hema, Sam's Club
- Social platforms: WeChat (work), Weibo (trending), Xiaohongshu (seeding), Bilibili (learning)
- Payment habits: Alipay, WeChat Pay coexist, credit payment popular (Huabei, Baitiao)
Psychographic Motivations:
- Pursue "work-life balance" but hard to achieve
- Value quality and efficiency, willing to pay to "save time"
- High anxiety: Career development, financial freedom, health wellness
- Strong self-actualization needs: Learning improvement, side hustles, knowledge payment
- Identity recognition: "I'm a person with taste and pursuits"
Consumption Characteristics:
- Value brand背后 values (environmental, public welfare, innovation)
- Like niche designer brands, new domestic brands
- Low loyalty, willing to try new products but return to rationality
- Willing to pay premium for "health," "organic," "sustainable"
Lower-Tier Market User Characteristics:
Demographics:
- Age: 25-45, wider age span
- Occupation: Small business owners, civil servants, teachers, self-employed, migrant workers
- Income: Family monthly 5,000-20,000 yuan
- Education: Mainly high school, vocational college
Behavioral Characteristics:
- Relatively slow life pace, value family life
- Information acquisition: WeChat Moments, Toutiao, Kuaishou, Douyin
- Shopping channels: Pinduoduo, local supermarkets, live streaming commerce, community group buying
- Social platforms: WeChat (family groups), Kuaishou (entertainment), Pinduoduo (shopping)
- Payment habits: WeChat Pay mainly, habit of cash-on-delivery
Psychographic Motivations:
- Pursue "value" and "cost-performance," not "cheapest"
- Value family responsibilities (children's education, parents' health, family meals)
- Trust acquaintance recommendations, believe "everyone buying"
- Enjoy psychological satisfaction of "getting deals" (bargaining, group buying, coupons)
- Social display: "I bought good stuff, share with relatives and friends"
Consumption Characteristics:
- High trust in big brands (Haier, Gree, Midea)
- Low acceptance of new brands, need social proof (sales, reviews, friend recommendations)
- Interested in "novel" products but cautious trying
- Price-sensitive, but willing to pay for "peace of mind" and "face"
Difference Summary:
| Dimension | First-Tier Cities | Lower-Tier Markets |
|---|---|---|
| Core Needs | Quality, efficiency, status | Value, trust, family |
| Information Channels | Professional media, Zhihu, Xiaohongshu | Moments, Toutiao, Kuaishou |
| Shopping Channels | Tmall, JD, Hema | Pinduoduo, live streaming, community group buying |
| Decision Factors | Brand values, product innovation | Price, acquaintance recommendations, sales |
| Trust Building | KOL reviews, professional media | Acquaintance recommendations, KOC authentic shares |
| Marketing Reach | Content marketing, scene marketing | Social viral, group buying bargaining |
Marketing Recommendations:
- First-tier cities: Deep content, quality marketing, experience marketing
- Lower-tier markets: Social传播, trust building, price promotions
Application and Decisions
Q11: How to apply user insights in brand naming?
User insights directly guide brand naming decisions:
Memorability Testing:
- Choose names users can easily pronounce and remember
- Avoid rare characters, complex spellings, polyphone ambiguities
- Test if users can remember after hearing once
Language Preference Matching:
- Use users' language and vocabulary
- Extract common words from user interviews and reviews
- For example: Young users like "small," "light," "fast," middle-aged and elderly users like "big," "complete," "stable"
Brand Personality Conveyance:
- Name should convey desired brand personality
- For example: "Xiaomi" (approachable, down-to-earth), "Huawei" (China's achievement, national pride)
- Test brand associations of name in target demographic
Cultural Adaptability Check:
- Check name's cultural meanings in different user segments
- Avoid negative associations or unlucky meanings
- For example: "Tide" (remove stains), "Rejoice" (soft hair)
Availability Validation:
- Check if domain, trademark, social media accounts available
- Avoid infringement and confusion
Testing Methods:
- Group Discussion: Invite 10-15 target users, discuss candidate names
- Association Test: Ask "What comes to mind seeing this name?"
- Memory Test: After showing name, ask "Can you remember? How spell?"
- Preference Voting: Let users vote for favorite names
- A/B Testing: Online test different names' click rates and conversion rates
Case References:
- Xiaomi: Homophone of Mobile Internet, caters to tech users
- Pinduoduo: Group buying + cheap, lower-tier market users understand immediately
- Perfect Diary: Perfect + diary, young women pursue refined self-expression
Remember: Best naming isn't "what boss likes," but "what users understand and remember."
Q12: How to apply user insights to product design?
User insights applications in product design:
Feature Prioritization:
- Prioritize by user pain point intensity and need frequency
- For example: Users' most painful "time waste" problem, prioritize solve "one-click operation" feature
- Use Kano model: Basic needs, expected needs, excitement needs
User Experience Design:
- Match user habits and preferences
- For example: Young users prefer minimalist interface, lower-tier market users prefer clear guidance
- Design user journey: Consider user emotional changes at each step
Pricing Strategy:
- Based on user willingness to pay and price sensitivity
- For example: First-tier city users accept membership subscriptions, lower-tier market users prefer one-time purchase
- Test different price points' conversion rates
New Feature Validation:
- Test if matches real user needs
- Do user interviews and usability testing before development
- Avoid developing "false demands" users don't need
Product Iteration Direction:
- Adjust based on user feedback and behavioral data
- Regularly review user satisfaction (NPS, CSAT)
- Identify churn reasons, optimize product
Specific Application Cases:
Case 1: Pinduoduo "Group Buy" Feature
- User insight: Lower-tier market users trust acquaintance recommendations, like social interaction
- Product design: Group buying mechanism, invite friends buy together cheaper
- Result: 15-20% conversion rate (traditional e-commerce 2-3%)
Case 2: Douyin "Algorithmic Recommendation"
- User insight: Gen Z choice difficulty, hope "swipe to content I like"
- Product design: Personalized recommendation based on user behavior
- Result: Daily usage time exceeds 100 minutes (industry highest)
Case 3: Perfect Diary "Xiao Wan Zi" Private Domain
- User insight: Young women don't know how to choose cosmetics, need guidance
- Product design: WeChat group "Xiao Wan Zi" provides 1-on-1 consultation and tutorials
- Result: Private domain user repurchase rate 40%+ (industry average 20%)
Implementation Recommendations:
- Early user personas guide MVP feature priorities
- Continuous user testing validates design assumptions
- Data monitoring tracks user behavior changes
- Regularly review product-market fit
Q13: How to apply user insights to marketing communication?
Channel Selection:
- Advertise where users appear
- For example: First-tier professionals → LinkedIn, Zhihu, office elevators
- Lower-tier families → Kuaishou, Pinduoduo, community group buying
- Gen Z → Bilibili, Xiaohongshu, Douyin
Content Strategy:
- Use topics and language users care about
- For example: New professionals → "How to improve efficiency," "Work-life balance"
- Lower-tier markets → "Money-saving strategies," "Family happiness"
- Gen Z → "Self-expression," "National trend culture"
Ad Creative:
- Address user pain points and motivations
- For example: Anxiety → "Others progressing, you can't fall behind"
- Social needs → "Use this product, friends all like"
- Instant gratification → "Buy now, see results immediately"
SEO Keywords:
- Use users' search vocabulary
- Extract from user interviews and search data
- For example: Users search "how to whiten" not "whitening product principles"
Social Media Strategy:
- Engage on platforms where users active
- For example: Xiaohongshu seeding, Bilibili tutorials, Douyin short videos
- KOL/KOC selection matches target user preferences
PR and Publicity:
- Choose media and KOLs users follow
- For example: Tech users → 36Kr, 虎嗅, GeekPark
- Young women → Xiaohongshu bloggers, beauty KOLs
- Lower-tier markets → Kuaishou influencers, local self-media
Specific Application Cases:
Case 1: Genki Forest
- User insight: Gen Z want sweet drinks but worry about health
- Marketing strategy: "0 sugar 0 fat 0 calories," health + tasty both satisfied
- Channels: Convenience stores, Xiaohongshu, Bilibili
- Result: 2 years valuation from 0 to 4 billion USD
Case 2: Luckin Coffee
- User insight: Professionals want coffee but Starbucks too expensive, too slow
- Marketing strategy: "Little blue cup, make big dreams don't queue," price only 1/3 of Starbucks
- Channels: Office pickup + delivery, APP ordering
- Result: 2 years opened 4500 stores, surpassed Starbucks China
Case 3: Florasis
- User insight: Gen Z identification with national trend culture, want to display cultural confidence
- Marketing strategy: "Oriental cosmetics, flower-based makeup," emphasize Chinese traditional cultural elements
- Channels: Li Jiaqi livestream, Xiaohongshu KOCs, costume drama placement
- Result: 3 years became Tmall Beauty TOP5 brand
Implementation Recommendations:
- When creating marketing brief, clarify target user personas
- A/B test different marketing content effectiveness
- Track ROI and conversion rates of each channel
- Regularly review user feedback and public opinion trends
Teams and Organizations
Q14: How to make teams truly understand and use user personas?
Methods to make user personas truly used:
Visual Display:
- Create posters, cards place in office areas
- User personas should be everywhere, not hidden in documents
- For example: Meeting room walls covered with user persona cards
Storytelling Training:
- Train teams with real user cases and stories
- Not list data and characteristics
- For example: Play user interview videos, share user letters
Regular Sharing Sessions:
- Monthly share user insights and new cases
- Invite different teams participate
- Encourage sharing own encountered user stories and insights
Decision Reference:
- In important decisions explicitly discuss "Does this match user persona?"
- Product reviews, marketing creative meetings first review user personas
- Decisions not matching user insights need strong justification
Incentive Mechanisms:
- Include user satisfaction, NPS in team KPIs
- Reward successful decisions based on user insights
- Punish failures from ignoring user insights
New Employee Training:
- User insights core content of onboarding
- First week should see real users or watch user interview videos
- Only understand users can make decisions aligned with user interests
Tool Integration:
- Integrate user personas into work tools and processes
- For example: Put user persona next to Figma design mockups
- Jira task cards link to user need sources
Create "User Story Culture":
- When team can naturally say "How would Xiao Li see this issue?"
- Indicates user personas truly integrated into organization
- User understanding becomes "common sense" not "research project"
Success Cases:
- Amazon: Every meeting leaves empty chair for "user"
- Alibaba: Every product manager regularly answers customer service calls
- Tencent: Meeting room walls covered with user personas and user quotes
Q15: Which team should responsible for user analysis? How to organize?
Organization Model Choices:
Model 1: Centralized (User Research Team)
- For: Mid-large enterprises (500+ people)
- Pros: High professionalism, unified methods, concentrated resources
- Cons: May disconnect from business teams, insights hard to land
- Structure: Independent user research team, supports multiple product lines
Model 2: Embedded (Within Product Team)
- For: Mid-sized enterprises (100-500 people)
- Pros: Close to business, fast response, insights easy to land
- Cons: Professionalism may be insufficient, inconsistent methods
- Structure: Each product team has 1-2 user researchers
Model 3: Hybrid (Centralized + Embedded)
- For: Large enterprises (500+ people)
- Pros: Balance professionalism and business closeness
- Cons: High cost, complex coordination
- Structure: Central team provides methodology and tool support, product teams have dedicated user researchers
Model 4: Distributed (Everyone Responsible)
- For: Startups (< 100 people)
- Pros: Everyone has user awareness, flexible and efficient
- Cons: Insufficient professionalism, chaotic methods
- Structure: Product managers, designers, operators all do user analysis
Role Division Recommendations:
User Researchers (if have):
- Design and execute user research projects
- Deep interviews, focus groups, surveys
- Data analysis and insight extraction
Product Managers:
- Define user problems need solving
- Transform user insights into product requirements
- Validate product-market fit
Designers:
- User journey maps, user experience design
- Usability testing, interface optimization
- Transform user insights into design language
Data Analysts:
- Quantitative data analysis, user behavior analysis
- A/B testing, conversion funnel analysis
- Data-driven decision support
Operations/Marketing:
- User feedback collection (customer service, communities, reviews)
- User insight applications in marketing campaigns
- User lifecycle management
Collaboration Mechanisms:
- Regular user insight sharing sessions (biweekly or monthly)
- Cross-department user research project groups
- User insight knowledge base (documents, videos, cases)
- Decision review mechanism (important decisions need reference user insights)
Startup Recommendations:
- Early: Founder/product manager directly do user interviews (closest to users)
- Growth: Hire dedicated user researchers or partner with external agencies
- Mature: Build user research team, support multiple product lines
Common Problems and Challenges
Q16: What if user analysis finds target users inconsistent with existing users?
Common situation, indicates product-market mismatch or brand positioning needs adjustment. Response strategies:
Diagnosis Phase:
Analyze Reasons for Inconsistency:
- Product positioning wrong? (Promised value doesn't match actual)
- Marketing channel wrong? (Reaching wrong demographic)
- Market change? (Target user needs changed)
- Data bias? (Existing users not true target users)
Evaluate Two User Types' Value:
- Ideal Target Users: Market size, growth potential, willingness to pay, service cost
- Existing Users: Revenue contribution, retention rate, recommendation rate, service cost
- Which group better fits brand long-term strategy?
Decision Phase:
Option 1: Migrate to Target Users
- If target users higher value and larger market
- Gradual migration, avoid suddenly abandoning existing users causing revenue cliff
- Strategy: Product feature adjustment, marketing focus shift, brand positioning optimization
- Case: Xiaomi gradually expanded from enthusiasts to mass market
Option 2: Embrace Existing Users
- If existing users high value and high loyalty
- Adjust brand positioning and product strategy, better fit existing users
- Strategy: Give up "ideal user" obsession, serve existing users well
- Case: Slack focused on team collaboration tool users, not chase individual users
Option 3: Dual Brand or Multi-Product Line
- If both types valuable but too different
- Create sub-brands or product lines, serve separately
- Strategy: Main brand serves core users, sub-brand serves other segments
- Case: Xiaomi (mid-high end) and Redmi (value) dual brands
Option 4: Strategic Transformation
- If existing users low value and target user market large
- Accept short-term revenue decline, exchange for long-term growth
- Strategy: Reposition, rebuild product, reacquire users
- Case: Airbnb transformed from "cheap accommodation" to "unique travel experience"
Migration Path Planning:
- Phase 1 (0-6 months): Keep existing business stable, small-scale test target user acquisition
- Phase 2 (6-18 months): Gradually adjust product features and marketing focus, attract target users
- Phase 3 (18-36 months): Complete user structure transition, new users >60%
Risk Control:
- Don't suddenly abandon existing users (revenue cliff risk)
- Monitor cash flow, ensure sufficient funds during transformation
- Maintain core product value, avoid pleasing neither
Q17: Users too diverse, how determine priority service which segment?
When facing multiple user segments, use value assessment matrix to determine priorities:
Evaluation Dimensions:
1. Market Size:
- How many users in this segment?
- Market growing or shrinking?
- Data sources: Industry reports, competitor analysis, third-party data
2. Growth Potential:
- Growth rate next 3-5 years?
- Any unmet needs?
- Emerging trends (e.g., Gen Z, lower-tier markets)?
3. Willingness to Pay:
- Users willing to pay for solution?
- Acceptable price range?
- Price sensitivity?
4. Cost to Serve:
- How high is CAC?
- Customer service and operations cost?
- Scale effects?
5. Competition:
- How many competitors in this segment?
- Blue ocean opportunities?
- Where our advantages?
6. Strategic Fit:
- Fits brand vision and values?
- Team capacity and resources to serve?
- Can establish long-term competitive advantage?
Scoring Method: Each dimension 1-5 points, calculate total and weighted scores (adjust weights by business)
| Segment | Market Size | Growth Potential | Willingness to Pay | Cost to Serve | Competition | Strategic Fit | Total |
|---|---|---|---|---|---|---|---|
| Segment A | 5 | 4 | 5 | 3 | 2 | 5 | 24 |
| Segment B | 3 | 5 | 4 | 4 | 3 | 3 | 22 |
| Segment C | 4 | 3 | 3 | 5 | 4 | 2 | 21 |
Reachability Validation: Even with high value assessment, validate reachability:
- What channels users concentrated in?
- CAC acceptable?
- Can establish continuous reach mechanisms?
- Trust transmission paths (KOLs, KOCs)?
Priority Sorting:
- Core Segment: Highest value + reachable (focus resources, execute extremely)
- Secondary Segment: Medium value + reachable (gradually expand, related product lines)
- Watch Segment: High value but hard to reach (wait timing or find partners)
- Abandon Segment: Low value + hard to reach (decisively abandon, avoid resource waste)
Remember:
- Early resources limited, must focus on 1-2 core segments
- First become #1 in segment, then gradually expand adjacent markets
- Better absolutely lead in niche market, than mediocre in mass market
Q18: How to balance existing user needs and innovation development?
Classic product team dilemma: satisfy existing user needs (conservative) or innovate development (risky)?
Analysis Framework:
Existing User Need Types:
- Basic Needs: Must satisfy, otherwise users churn (e.g., feature stability, performance)
- Expected Needs: Better satisfied, users dissatisfied if not (e.g., new features, optimized experience)
- Excitement Needs: Surprise, exceed expectations (e.g., innovative features, unique experience)
Innovation Types:
- Incremental Innovation: Optimize on existing foundation (low risk, medium return)
- Breakthrough Innovation: Create completely new value (high risk, high return)
- Business Model Innovation: Change value creation and capture methods (medium risk, high return)
Balance Strategies:
70-20-10 Rule:
- 70% Resources: Satisfy existing users' core needs (basic + expected needs)
- 20% Resources: Incremental innovation (optimize experience, new features)
- 10% Resources: Breakthrough innovation (explore future, bold experiments)
Dual-Track Development:
- Core Team: Focus on existing users, continuously optimize product and experience
- Innovation Team: Explore new directions, allow trial and error
- Cases: Google's 20% time policy, Amazon's "two-pizza teams"
Data-Driven Decisions:
- Existing User Needs: Identify through user feedback, NPS, customer service data
- Innovation Directions: Discover through user research, trend analysis, tech exploration
- A/B testing validation: Small-scale test innovations, data-driven promotion decisions
Risk Management:
- Existing Needs: Ignoring leads to churn (short-term risk)
- Over-Innovation: May deviate from core users, product complexity (mid-term risk)
- Lack of Innovation: Surpassed by competitors, lose market (long-term risk)
Specific Methods:
-
User Need Prioritization Matrix:
- X-axis: User need intensity (very painful → somewhat painful)
- Y-axis: User count (many users → few users)
- Priority: Very painful + many users > Very painful + few users > Somewhat painful + many users
-
Innovation-Satisfaction Balance Map:
- Draw product feature matrix: existing features vs new features
- Ensure each version includes existing need satisfaction + innovation elements
- Avoid "only optimization" or "only innovation" extremes
-
User Participation in Innovation:
- Invite core users participate product design and testing
- User co-creation workshops
- Beta testing programs, let users early experience new features
- Case: Xiaomi's "participation" culture, users participate product iteration
Success Cases:
- Apple: 70% satisfy existing needs (iPhone annual iteration optimization) + 30% innovation (Vision Pro, Apple Car exploration)
- Tencent: WeChat basic features stable (satisfy existing needs) + Mini Programs, Video Accounts (innovation exploration)
- ByteDance: Douyin algorithm optimization (existing needs) + Education, Gaming, E-commerce (innovation expansion)
Key Principles:
- Don't innovate for innovation's sake: Innovation must solve real user problems
- Don't ignore existing users: They are revenue foundation and word-of-mouth source
- Small steps fast run, continuous validation: Innovation starts with small-scale testing, data-driven decisions
- Keep core value stable: No matter how innovate, brand core value can't change
Q19: How to combine user analysis with data analysis and business metrics?
User analysis (qualitative) combined with data analysis (quantitative) to get complete user insights:
Data-Driven User Analysis Process:
Step 1: Quantitative Data Discover Anomalies or Opportunities
- Data analysis finds certain user group low retention
- Certain feature usage unusually high or low
- Certain channel CAC unusually high
- Certain product line repurchase rate declining
Step 2: Qualitative Research Investigate Causes
- User interviews: Why do low-retention users leave?
- Usability testing: Why certain feature usage low?
- Competitor analysis: Why certain channel CAC high?
- Customer service data analysis: What feedback from declining repurchase rate users?
Step 3: Form Insights and Hypotheses
- Identify root causes (e.g., users don't know feature exists)
- Propose solution hypotheses (e.g., add feature guidance and tutorials)
- Predict impact (e.g., expect 5-10% retention improvement)
Step 4: A/B Testing Validation
- Design A/B test validate hypothesis
- Control group: Existing product
- Experimental group: Optimized product
- Metrics: Retention rate, conversion rate, satisfaction
Step 5: Iterative Optimization
- Decide whether to scale based on test results
- Continuously monitor key metrics
- Regularly review if user insights still accurate
Combination Example Points:
1. User Segmentation + RFM Analysis
- RFM: Recency (last purchase), Frequency (purchase frequency), Monetary (purchase amount)
- User Segmentation: Divide users into high, mid, low value by RFM scores
- Combination: Different segments have different user personas and marketing strategies
2. User Journey + Funnel Analysis
- User Journey: Complete path from awareness to recommendation
- Funnel Analysis: Conversion rate and churn rate each step
- Combination: Identify churn points, explore churn causes through user interviews
3. NPS + User Feedback
- NPS (Net Promoter Score): Quantitative indicator of user recommendation willingness
- User Feedback: Specific reasons for recommend or not
- Combination: NPS identifies problem severity, user feedback provides improvement direction
4. User Personas + Behavioral Tags
- User Personas: Qualitative description (e.g., "price-sensitive user")
- Behavioral Tags: Quantitative tags (e.g., "coupon usage >5 times")
- Combination: Qualitative personas guide strategy, quantitative tags precise targeting
5. User Needs + Feature Usage Data
- User Needs: What features users say they want
- Feature Usage Data: What features users actually use
- Combination: Discover inconsistency between "said" and "did," find real needs
Metrics System Establishment:
North Star Metric:
- Definition: Single metric best reflecting user value and business long-term success
- For example: Spotify's "total listening time," Airbnb's "nights booked"
- Role: Align team, ensure all optimizations around core user value
User Health Metrics:
- Retention rate (Day 1, Day 7, Day 30)
- Activity (DAU, MAU)
- Usage depth (feature usage rate, usage time)
- Satisfaction (NPS, CSAT)
Business Metrics:
- Customer Acquisition Cost (CAC)
- User Lifetime Value (LTV)
- LTV/CAC ratio (health should be >3)
- Retention rate, repurchase rate
Combination Key:
- Quantitative tells you "what" and "how much"
- Qualitative tells you "why" and "how"
- Only combination enables informed decisions
Case: 某 e-commerce brand discovered repurchase rate declining (quantitative data anomaly) → User interviews found "don't know new products launched" (qualitative investigate causes) → Hypothesis "add new product notification feature can improve repurchase rate" → A/B test validation (experimental group repurchase rate up 15%) → Scale fully, continuously monitor repurchase rate metrics
Q20: How to measure ROI of user analysis? Prove its value?
User analysis ROI measurement indeed challenging, but can evaluate from multiple dimensions:
Direct ROI Quantification:
1. Customer Acquisition Cost Reduction:
- Baseline: CAC before user analysis
- Optimized: CAC after user insight-based precise targeting
- ROI = (CAC reduction amount × user count) / user analysis cost
- Case:某 brand optimized ad placement by user personas, CAC from 200 to 120 yuan, saved 80 yuan/person, annual 8 million saved (100k new users)
2. Conversion Rate Improvement:
- Baseline: Conversion rate before optimization
- Optimized: Conversion rate after user insight-based landing page optimization
- ROI = (revenue from conversion rate increase) / user analysis cost
- Case:某 brand landing page conversion rate from 2% to 3.5%, annual revenue increased 5 million
3. Customer Retention Rate Improvement:
- Baseline: Retention rate before optimization
- Optimized: Retention rate after user insight-based product and service optimization
- ROI = (LTV increase from retention rate improvement) / user analysis cost
- Case:某 brand Day 30 retention rate from 30% to 40%, annual LTV increased 12 million
4. R&D Efficiency Improvement:
- Costs saved avoiding "false demand" development
- User insights help identify truly important features
- ROI = (R&D costs saved avoiding waste) / user analysis cost
- Case:某 brand cut 3 useless features before development through user testing, saved 5 million R&D costs
Indirect ROI Assessment:
1. Decision Speed Improvement:
- User insights reduce decision discussion time
- From "we think users need what" to "data shows users need what"
- Evaluate: How much decision cycle shortened?
2. Team Alignment:
- User personas help product, marketing, sales, customer service teams align understanding
- Reduce internal friction and duplicate work
- Evaluate: How much cross-department collaboration efficiency improved?
3. Brand Consistency:
- User insight-based brand positioning more consistent
- All touchpoints (product, marketing, customer service) deliver unified message
- Evaluate: How much brand awareness and loyalty improved?
4. Innovation Success Rate:
- User insight-based innovations more likely to succeed
- Reduce failures from "gut-feeling" decisions
- Evaluate: How much new product/feature success rate improved?
Measurement Methods:
Before-After Comparison:
- Compare key metrics before and after user analysis
- CAC, conversion rate, retention rate, NPS, etc.
- Control other variables, only change "whether use user insights"
A/B Testing:
- Group A: Decisions based on user insights
- Group B: Decisions not based on user insights (or based on assumptions)
- Compare performance differences between groups
Case Analysis:
- Collect specific success cases
- For example: "Optimized landing page by user personas, conversion rate up 75%"
- Compile into case library, prove value
User Feedback:
- Internal team feedback: "User insights helped us fast decisions"
- External user feedback: "This product really understands me"
- Regularly collect and display feedback
Build ROI Report:
Cost Side:
- User research team personnel costs
- User interview expenses (gifts, venues)
- Tool and platform costs (SurveyMonkey, UserTesting)
- Training and knowledge sharing costs
Benefit Side:
- CAC reduction savings
- Conversion rate increase revenue
- Retention rate increase LTV
- R&D efficiency savings
- Decision speed improvement value
ROI Formula: ROI = (Total Benefits - Total Costs) / Total Costs × 100%
Example Calculation:
- Total costs: 1 million (user research team + tools + interviews)
- Total benefits: 8 million (CAC save 5 million + conversion increase 2 million + R&D efficiency 1 million)
- ROI = (8-1)/1 × 100% = 700%
Continuous Tracking:
- Quarterly review user analysis ROI
- Report value and impact to management
- Optimize user analysis methods and processes
Remember: User analysis ROI not only reflected in direct financial metrics, but more in decision quality, team efficiency, brand long-term value. Some benefits hard to quantify, but long-term impact profound.
Drive Brand Decisions with User Insights
Generate your unique brand identity in minutes with AI
Related Guides
Brand Positioning Strategies
Why it fits: Positioning starts with users
Brand Naming Best Practices
Why it fits: Naming should fit user language
Building Brand Identity
Why it fits: Identity style matches user aesthetics
Website Branding Best Practices
Why it fits: Above-fold content matches needs
Color Psychology in Branding
Why it fits: Colors influence user perception
Word-of-Mouth Brand Strategies
Why it fits: Communication depends on user motivations